Baseline Year: FEA: Surplus Producing Kasungu-Lilongwe Plain, Malawi
- Chronic poverty and food insecurity persists.
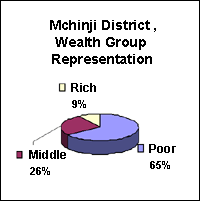
- 65% of the population lack access to capitol to improve food production or expansion to other economic activities is a feature of this impoverished group
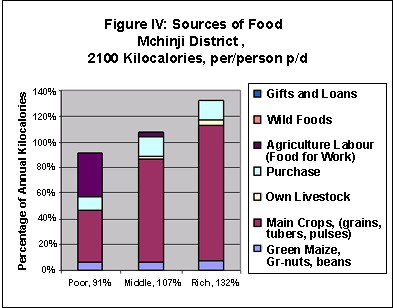
Baseline Year, Sources of Food
- Even under normal conditions, the poor wealth group only achieve 90% of their annual food needs.
- 46%, comes from their own production and the remainder comes from agriculture labour (FFW) roughly 34% and purchase (10%)
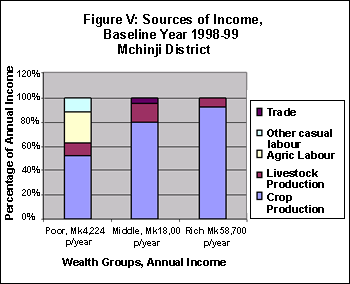
Baseline Year, Sources of Income
-
the majority of the poor obtain most of their income in the form of maize grain by carrying out labour activities within the community and neighbouring tobacco estates
- 12% of their income also comes from other casual labour activities, this includes: firewood collection, charcoal , thatching grass, brick making, etc.
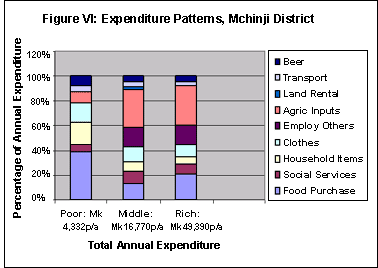
Baseline Year, Expenditure Patterns
- Even after poor households have exchanged their labour for food, (34%), they still need to purchase an additional 40% from their earnings.
- food being purchased are basic staples (maize, sweet potatoes, and beans. There is little diversity in their diet.
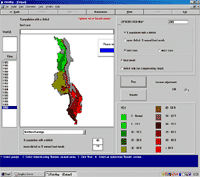
Modelling the impacts of the current crisis using the RiskMap Software
- RiskMap, was developed to facilitate the analysis of large data sets over large geographical areas.
- By the end of 1997, the RiskMap project had generated national databases in 11 African countries, including Malawi
The analysis and vulnerability prediction 2002-03
- In order to model the impacts and to encapsulate the situation of last year, as well, as the current period, a two-year modelling exercise was developed.
- Crop production losses and maize prize increases were inputted for each Food Economy Zone. In the centre and south, crop production losses for both years are in the range of 60 to 80% of normal and price increases are in the range of 300 to 400%.
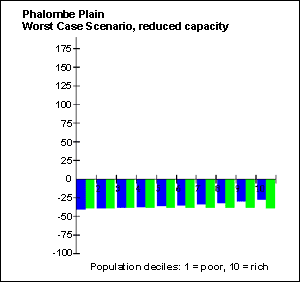
Results - Scenario Analysis .Example: Phalombe Plains (1 of 21 FEZs)
- The histogram shows the estimated change in food supply resulting from the problem specification
- With reduced capacity to overcome further shocks the deficit for the deficit population is estimated to be 37% of normal
- Total population affected approximately 315,000, with a total food tonnage requirement of 57,500 mts
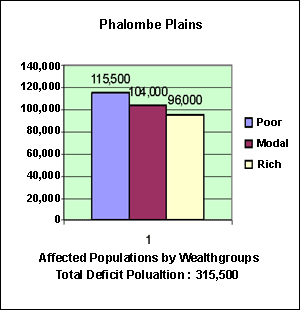
Levels of Vulnerability - Phalombe Plains, reduced capacity
- For purposes of targeting the most vulnerable, this graph illustrates the socio-economic breakdown of the population, who are potentially requiring food aid and/or livelihood support
- Without a signifcant intervention, further livelihoods failures and potential destitution is anticipated for all 3 wealth groups.
|