2. MAIN FINDINGS – GAMBULI
Background and Population
The settlement was established by a Chief Manhenga of Manhenga Clan in the early 1990s with an initial 300 households settling in the area. Most of the settlers are said to have come from areas such as Hurungwe, Masvingo, Makonde and Gokwe areas. It was also recorded that other people came from the commercial farms and mining areas. Gambuli farm is comprised of 3 farms that belonged to a commercial farmer, and which was later acquired by the State. Later the state leased the farm to a Mr Machipias up until 1999 when he moved out. The local leaders noted that from 1992 up to the year 2000, the settlers suffered quite a number of evictions by the state as they were regarded as illegal occupiers. A number of settlers moved into the area taking advantage of the launch of the fast-track land resettlement programme, which commenced in July 2000. Part of this group were said to be former farm workers.
At the time of this assessment (September 2001) a total of 1,006 households were residing on the farm. From the study that was carried out by FCTZ (July 2001) 14.4% of the settlers are estimated to have originated from the commercial farms, while 77.4% originate from communal areas. The residents are now offering resistance to any other further incoming settlers arguing that the area has reached its capacity. New arrivals are said to find it easier to go to Chihwiti, which is about 10 kilometres away, since there are more ex-farm workers already resident there, and there is more land available. At the present moment, Gambuli settlement is divided into 10 villages each being led by a local leader and the village structures are their vehicles of development.
Wealth Ranking
|
Poor |
Middle |
Better off |
| % of Total Population: |
45% |
40% |
15% |
| Livestock Holdings: |
|
|
|
| Cattle |
0 |
1-2 |
> 5 |
| Donkeys |
0 |
2 |
4 |
| Goats/ Sheep |
2 |
4-5 |
> 10 |
| Chickens/ poultry |
4-5 |
5-20 |
> 20 |
| Land under cultivation |
3-4 acres |
5 acres |
6-12 acres |
| Average Harvest is Exhausted by |
August/ September(5 months)“Masunda chando”(Through winter) |
December/ January(9-10 months) “Ruswa runyoro” (To the time of new grass) |
12months+. They have surplus for sale and can also feed their livestock |
| Piecework: |
Go for piecework twice a week |
Only go when they have a problem. |
They provide others with piecework |
| Education for children: |
Their children go as far as primary education. They do not have uniforms and food to take to school. Have problems in paying of school fees. |
Their children generally complete primary school, but few attend secondary school consistently because of problems with school fees. |
They can manage to send their children to school up to any level. |
Sources of Food
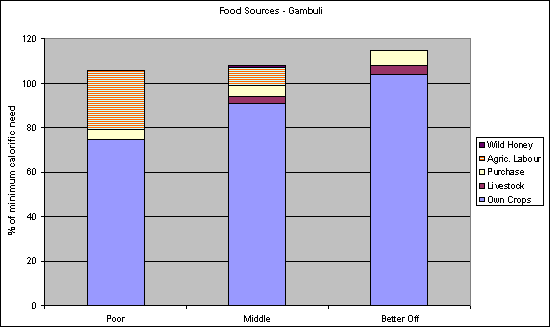
Sources of food for Gambuli were found to be similar to those in Chihwiti. However, the shares from each source differ, with those in Gambuli realizing quite a lot of their food requirements from own crop production. The chart below represents the percentages of food requirements the different wealth groups get from every source:

As indicated in the chart above, all the three wealth groups access more than 100% of their minimum food requirements, and are therefore expected to be food secure at least until the next harvest.
Own Food Crops
All the wealth groups have access to a variety of crops with maize, sweet potatoes, groundnuts and pumpkins contributing quite significantly to their minimum food requirements. The better-off group is managing to get more than 100% of food requirements from own crop production. It was also noted that the better-off group managed to produce enough maize grain to last their families for the whole year with a surplus either for sale or for payment of agricultural labour. The poor and the middle groups get nearly 80% and 96% of their minimum food requirements from own crops respectively.
Despite the fact of tenure insecurity, the present agricultural practices indicate that, given the opportunity, the area has potential for very good yields. The yields that were reflected during the assessment for the different wealth groups reveal that they are getting reasonably amounts in the face of tenure uncertainties. The poor group, without any draught power and only cultivating between one and two acres of maize (out of a total area under cultivation of up to 4 acres) are able to harvest enough to last them through winter (May to August), referred to as “masunda chando”. The middle group’s harvest lasts for 9-10 months which takes them through to the period of “new grass” or “ruswa runyoro” (December and January).
Piecework/Agricultural Labour
After exhaustion of their harvests in August, the poor manage to find piecework that enables them to earn grain and income to feed their households until the next harvest. Since the settlers are still opening up new lands for cultivation, a lot of agricultural-related piecework is earning both the poor and the middle groups enough grain to meet their minimum food requirements. The seasonal calendar indicates the types of piecework and the periods such activities are undertaken.
Purchase
The contribution of purchase to the total minimum food requirements for all the groups is relatively low when compared to the other sources of food. Cooking oil and sugar are the only significant foods they purchase with quantities increasing from the poor to the better-off groups. Food crops such as sweet potatoes and pumpkins substitute for bread and other foods that people normally buy for breakfast and lunch.
Livestock products
Livestock contribute to the food requirements of the middle and better off groups only. This contribution is also relatively low since some settlers are still building their stocks, while others have left livestock in the communal areas from which they originated. The rate of slaughtering is very similar to that of Chihwiti where only small livestock such as chickens and goats are slaughtered on special occasions.
Wild Honey
The collection of wild honey takes place in two periods, from November to January and from March to July. Honey is both consumed and sold, and the quantities consumed provide a small contribution (1-2%) to total food needs.
Sources of Income
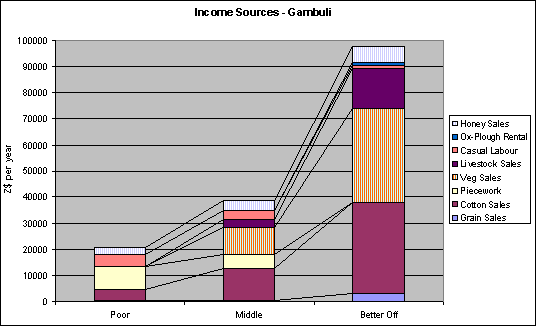
The chart below indicates the contribution in annual monetary terms, of each source of income to the households of different wealth groups.

Comparing Chihwiti and Gambuli, it can be seen that each of Gambuli’s wealth groups is somewhat better off than their counterparts in Chihwiti. (Gambuli’s “poor” earn more than Chihwiti’s poor group, but less than their middle, etc.) There are some differences in income sources between the two settlements. For example, gold panning and remittances were significant in Chihwiti, while wild honey sales were a significant source of income in Gambuli. Cotton sales were also seen to be important as a source of income for the two settlements.
Grain Sales
Only the better-off group can afford to sell surplus grain but the contribution is relatively low (below Z$3,000 per season) when compared to other sources such as cotton and livestock sales. The better-off group indicated that they stock surplus grain to pay for agricultural labour rather than for sale. The poor and middle groups do not earn any income from grain sales as they do not harvest any surplus.
Cotton sales
All the three groups have significant income from cotton sales. The poor manage to harvest and sell some cotton although they indicated that they could not afford to buy chemicals for their cotton, hence their low yields. They can manage to harvest up to a bale (200kg). Due to absence of inputs, the grade of the cotton which they harvest is the lowest, earning Z$4,000 per bale this year. The better off group is earning a relatively fair income from their cotton sales despite the small acreage that they cultivate. Their cotton enters the highest paying grade (earning at least Z$7,000 per bale). There is good potential for cotton production in this area, only that many are not able to afford the inputs necessary to maximise yields.
Piecework/Agricultural Labour
Piecework or agricultural labour is a significant source of both food and cash income for the poor and some households in the middle group. However the latter tend to have limited time to go for piecework since they spend most of the time in their own fields. The poor quickly opt for piecework due to limited harvests they produce themselves, which lasts not more than 4 months. The poor group indicated that during the months soon after harvesting, they would rather work for cash than for food since they would be eating their own crops. Then later when they finish their harvest, they start working for food. Cotton-picking and non-agricultural piecework such as grass cutting and building activities are normally paid in cash.
Vegetable Sales
The better off and the middle groups indicated that they were earning quite a significant amount from vegetable sales. They sell tomatoes and green leafy vegetables within the area and also to the traders from nearby Chinhoyi town. However, they raised the issue that their gardens suffer from the problem of water shortage since most of the boreholes in the area have been vandalized.
Casual Labour
This category comprises a diverse range of activities, which individually may not employ large numbers of people, but which when combined provide just below 25% and 10% of total income for the poor and middle groups respectively. Among the activities included here are brick-making, construction of huts, cutting of grass and collecting/ selling firewood and water.
Ox-Plough Rental
Some families within the better off group rent out the use of their ox-ploughs to those in the middle group who cannot afford their own draught power.
Honey Sales
Wild honey provides income for many households across the three wealth groups. The honey is sold to a trader who comes to the area. Income from honey sales ranged from Z$4,000 to Z$6,000 per household per year with the amount depending on the ability to grade the honey into correct grades before selling.
Livestock Sales
Although the settlers of Gambuli are still building their livestock holdings, they also sell small livestock like chicken and goats, and sometimes sell cattle in order to cover expenses such as school fees. Livestock sales are only significant in the middle and better-off groups.
Expenditure

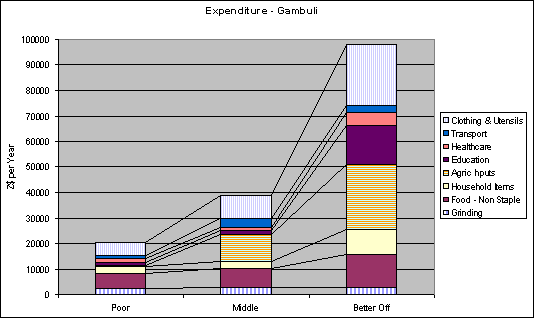
The patterns of expenditure shown above for the three wealth groups shown above show clearly how, as more income is earned, expenditure on the most basic needs changes little, but expenditure on productive inputs and non-essential goods increases markedly. A similar amount is spent by all groups on the grinding of maize, as total amounts of the staple food consumed by households changes little as income rises. Spending on maize or maize meal is typically zero in Gambuli, as most families either are self-sufficient or access additional maize through labour exchange.
Spending on non-staple foods changes almost in proportion to changes in income. For the poor, such spending covers small amounts of items like cooking oil, sugar, tea, meat, fish and bread or wheat flour. This contrasts with Chihwiti, where the poor’s limited income does not even allow them to purchase any of some of these items. As income rises in Gambuli the quantities of such items purchased tends to increase, and additional “luxury” items such as rice are added. A similar pattern exists for spending on clothing and utensils and on household items (such as soap, lotion, and paraffin).
Expenditure on transport and healthcare differs little between the three groups. Most of the spending on health in fact relates to transport to the nearest clinics, over 20km away, rather than on drugs or consultation fees. The siting of a clinic closer to these settlements, therefore, would not only improve healthcare provision but would also save money and time for the settlers.
There are very significant differences between the groups in relation to spending on education and agricultural inputs, however. The big jump in spending on education between the middle and better off occurs because typically only the better off send their children to secondary school, where costs are much greater (fees, uniforms, and transport or boarding expenses, as the nearest secondary school is at Kenzamba, approximately 20km away).
As income rises, there is also greater investment in agricultural inputs. Whereas the poor are limted to purchasing basic hand tools, the middle purchase certified seed and some fertilisers/ chemicals, while the rich purchase draught power and hire labour in addition to purchasing improved inputs for cotton and food production.
|


