|
|
|
Household Economy Assessment: Chihwiti and Gambuli Informal Settlements - October 2001
|
|
| |
1.MAIN FINDINGS – CHIHWITI
Background and Population
Unlike Gambuli, Chihwiti still has the capacity to accommodate new settlers, and the settlement has seen an increase in population in recent times. The first people came to Chihwiti in 1992, and were mainly retrenched mine workers and commercial farm workers. Numbers gradually increased in the first years of the settlement, and by the end of 1995 there were 476 households. An eviction order was served in December 1995 and the settlement was cleared. However people began returning again by early 1996. Another attempt was made to move people in 2000, but this was abandoned.
At present, community leaders in Chihwiti estimate that there are between 650-700 households in the settlement. FCTZ (2001b) found an average of 5.4 people per household, which would indicate a total population of 3,500 – 4,000. However, estimating the total population is difficult. There is a formal registration mechanism for new households, but while full households typically are registered, new individuals have also been arriving and staying with relatives who are existing settlers. Most of these individuals are not being registered. Extrapolating from estimates of new arrivals provided by four of the eight kraal heads in the settlement, it would seem that the population is currently increasing at a rate of 80-100 people per week.
As of July 2001, FCTZ estimated that 66% of the residents originated from commercial farms, 22% from communal areas, and the remaining 12% from mines, urban and other areas. New arrivals are mainly said to be commercial farm workers who have been retrenched as a result of the ongoing land reform programme. They typically arrive with some cash from retrenchment packages. They are able to avail of similar employment opportunities open to other settlers and either receive an allocation of land for cultivation themselves, or (in the case of individuals) help on the farms of relatives. Community leaders did not consider the new arrivals to constitute a separate wealth-group, as their livelihoods quickly become indistinguishable from the rest of the community. In addition, as existing settlers re-build their houses every few years, it is not possible to identify new settlers by their housing conditions.
Wealth Ranking
Community leaders identified three broad wealth groups within Chihwiti, referred to as the poor (“varombo”), middle (“varipakatinepakati”) and better off (“vafumi”). The following table indicates the characteristics of each group:
|
Poor |
Middle |
Better off |
| % of Total Population: |
70-80% |
15-20% |
5-10% |
| Livestock Holdings: |
|
|
|
| Cattle |
0 |
1-2 |
5-6 |
| Goats |
0 |
5-6 |
10 |
| Donkeys |
0 |
1-2 |
4 |
| Chickens |
< 20 |
< 10 |
< 10 |
| Land Area Cultivated: |
3-4 acres |
5-6 acres |
Up to 10 acres |
| Of which |
|
|
|
| Maize |
2 – 2 Ѕ acres |
2 Р… - 3 acres |
4 acres |
| Cotton |
Р… - 1 acre |
2 acres |
4 acres |
| Other crops |
Р… acre |
2 acres |
4 acres |
| Average harvest is exhausted by: |
July/ August(3-4 months) |
March/ April(11-12 months) |
Harvest carries over to next year |
| Piecework: |
Do piecework for better off |
Do piecework for better off; some hire draught power from better off |
Employ poor and middle on farms; rent out draught power to some middle |
Compared to many communal areas, Chihwiti’s wealth-ranking profile indicates low levels of livestock holdings. The explanation provided for this was that, because of the unofficial legal status of the settlement, residents are cautious about investing in livestock for fear of being evicted from the land again at some time in the future. This means that savings (for those in the middle and better off groups who can afford to save anything) are more likely to be in the form of cash rather than livestock. In the current inflationary environment, this could be problematic for those groups.
Sources of Food
The chart below shows the percentages of minimum food requirements (based on 2,100 kcals per person per day) averaged out over the current year which are accessed through various sources.
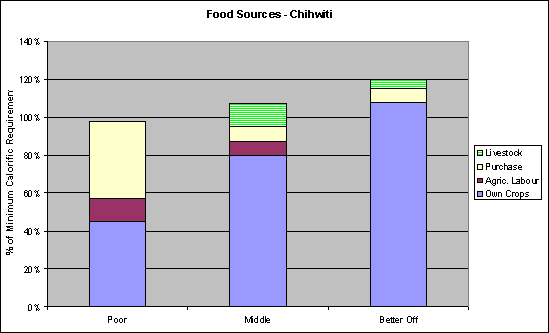
In total, the middle and better off groups are expected to be able to access more than 100% of their minimum food needs this year. Some of the poor may have a minor deficit, as they are predicted to be able to access between 85% and 110% of their minimum needs. The extent of the difference between the three groups in terms of diversity in the diet is less marked in Chihwiti than in other areas recently assessed.3 Most of the difference in total calorific intake is accounted for by greater quantities of sweet potatoes, cooking oil and sugar in the diets of the middle and better off groups, while those groups also consume greater quantities of meat and fish.
Own Crops
There is quite a diverse range of food crops grown in Chihwiti. By far the most important in terms of food intake is maize. The middle and better off groups have reasonably good yields as they can afford to purchase certified seed, whereas the poor plant seed retained from the previous year’s harvest. Production this year was reported to have been slightly below average, but no secondary data for these settlements is available from Agritex to verify that. The poor are the only group which does not sell any of its grain harvest. Their grain harvest tends to last only for 3-4 months, and they must therefore depend on income or labour exchange to access their remaining grain needs. The middle and the better off both sell significant amounts of grain.
In addition to maize, other important crops grown here are sorghum, sweet potatoes, groundnuts, roundnuts/ bambara nuts, pumpkin and various leafy vegetables.
Agricultural Labour
As is described in greater detail under sources of income, many people find casual employment either on nearby commercial farms or on local farms owned by the better off, doing piecework such as land clearing, weeding and harvesting or picking cotton. Payment for this labour can be given either in the form of food or in cash. If payment is made in food, depending on the task, it can take 4 – 6 man-days to earn 1 bucket (roughly 20kg) of maize grain. Generally, it is more common for people to be paid in food during the weeding period (which is after most poor households have exhausted their own stores of food), and in cash during the cotton picking period (which is soon after the maize harvest).
Purchase
For the middle and better off, purchased food only provides 5-10% of food needs. As is indicated under “Expenditure” below, a diverse basket of non-staple foods is purchased, including cooking oil, sugar, meat, kapenta (dried fish) and bread. For the poor, purchased food provides approximately 40% of food needs, and almost all of this is accounted for by maize grain. Only small amounts of cooking oil and sugar are also purchased, with meat and fish being rarely consumed.
Livestock Products
Animal products from own livestock account for a relatively small source of food for the middle and better off groups, and are insignificant for poor households. All groups occasionally consume a chicken, and the middle and better off slaughter a small number of goats on special occasions. Most of the calories from this source, however, come from milk obtained from cows during the rainy season. Milk is mainly given to children mixed into a porridge.
Sources of Income
Income levels vary widely between the three wealth groups in Chihwiti, and are mainly determined by the agricultural output of each group. The better off have the least diversified income base, being able to earn sufficient income predominantly from maize and cotton sales. The poor and middle engage in a wider range of activities.
As the current assessment was interested in the period up to the next maize harvest in April 2002, the 12 months from May 2001 were covered. Therefore actual income is recorded for grain, cotton and vegetable sales, while income levels for piecework, livestock sales, remittances and gold-panning combine actual income earned to date with predicted income for the rest of the period based on previous experience, as estimated by interviewees.
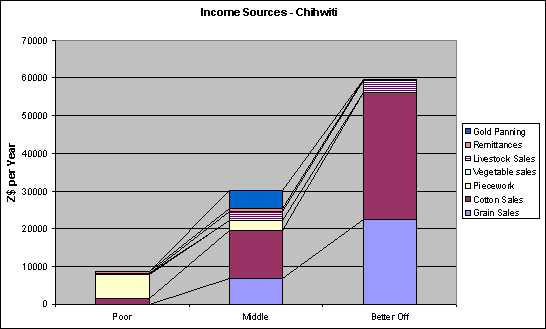
Grain Sales
Households in the middle and better off wealth groups sell a portion of their maize harvest to earn cash for their other needs. Sales are made both to local private buyers (who claim to use the grain as payment for labourers they employ either on farms or in small-scale mining enterprises) and to the Grain Marketing Board (GMB).
Cotton Sales
Cotton production is a very important source of income for the middle and better off groups, but is also significant for the poor. The latter cultivate a small area of cotton, and this year harvested on average just over one 200kg bale, while the better off harvested and sold an average of 7-8 bales. The middle and better off are also able to afford more fertilizer and chemicals, and therefore get better yields in addition to planting a larger area. Cotton is sold mainly to Cottco in Chinhoyi.
Piecework
Piecework (i.e. undertaking agricultural labour, with payment based on completion of a specific task such as weeding one line of maize, or clearing one acre of land) is by far the most important source of income for the poor, and therefore for the majority of the population. Piecework is available both locally, on the farms of the better off, and on nearby commercial farms. For local farms, the work is mainly in cotton picking, land clearing, and weeding of maize and cotton. Peaks occur during the weeding and cotton picking seasons, but employment is nonetheless available at most times of the year. One farm in Alaska (close to Chinhoyi) seems to provide most of the employment on the commercial farming side. Lorries come to Chihwiti to take casual workers to the farm every morning during the peak seasons, and employment is said to be readily available – anyone who wants to work is said to be able to get some employment.
Vegetable Sales
The poor group make some income from the sale of vegetables such as rape and tomatoes, however the quantities sold do not account for large amounts – less than 5% of the small total income for this group. Vegetable sales were not mentioned as significant for the middle or better off households.
Livestock Sales
As stocks of cattle and goats are quite limited in Chihwiti, livestock sales are not as significant a source of income as might be expected for a rural community such as this. The poor and middle make small amounts of money from the occasional sale of chickens, while the better off earn approximately 5% of their total income through the sale of a small number of goats and some chickens.
Remittances
A similar picture to other recently-assessed areas emerged in Chihwiti regarding remittances. Previously this would have been considered quite an important source of income for most families, in this case because most families still had relatives working elsewhere on commercial farms. However, due to the combination of widespread general economic hardship and particular problems in the commercial farming sector, amounts remitted are now small and infrequent and would amount only to several hundred dollars per year.
Gold Panning
Only the middle group reported engaging in gold panning in the many rivers in this mineral-rich area. Details on the activity were limited, but for the middle group it could account for 10-15% of total income.
Expenditure
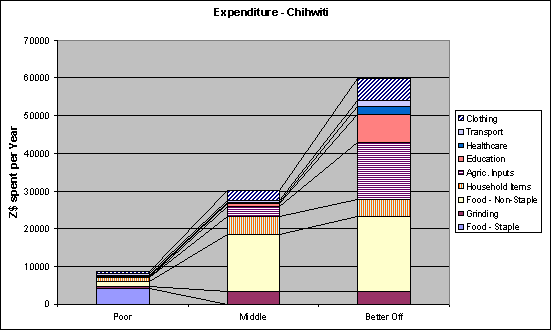
Some differences in expenditure patterns between the three wealth groups were quite evident from this assessment. Only the poor group purchase maize (the “Food – Staple” category in the graph above), as the other groups produce enough to meet their own needs. The poor spend just under 50% of their total income on maize grain, and when the costs of grinding and expenditure on non-staple foods (which include items such as cooking oil, sugar and salt) are added, all food-related expenditure uses up approximately 70% of this group’s total income. The rest of their income is spent on household items (such as soap and lotion), education, healthcare, transport and clothing. The amounts spent on each of these categories is very small. For education, poor households can typically only afford to send one child to the nearest primary school at Kanyaga. This is consistent with the finding in the FCTZ baseline survey that many children do not attend school because of a lack of funds (although the distance to the school is also a significant factor).
For the middle and better off groups, absolute expenditure on grinding, non-staple foods and household items is very similar. However, the better off use the balance of their much larger income mainly on agricultural inputs, education and clothing. For the better off, these agricultural inputs include certified maize and cotton seed, chemicals and equipment for cotton cultivation and cash for hiring labour. The middle also purchase certified seed, but in smaller amounts. Expenditure on education increases significantly for the better off households, as they typically can afford to send a child to secondary school.
|
| |
Footnotes:
- Especially Mutorashanga, Binga and Nyaminyami (SC: 2001a, b, c) and Harare (FEWS Net: 2001)
|
|