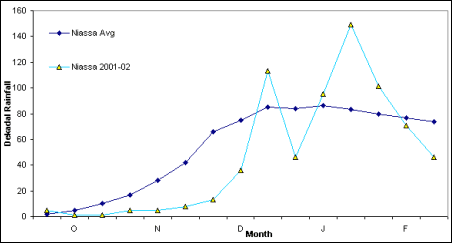
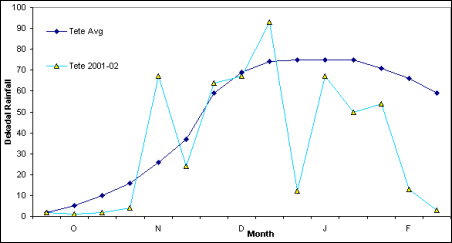
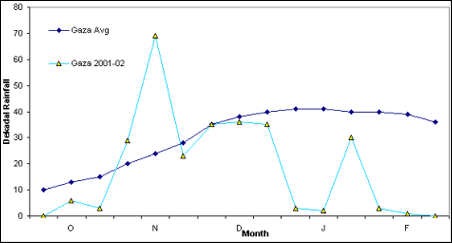
Mozambique – Rainfall distribution in 2001/02 agricultural season
A. NORTH

B. CENTRE

C. SOUTH

|
Cereal Production in 2000/01 and 2001/02 by Regions ('000 tonnes)
| |
Maize |
Sorghum & Millet |
Rice (Paddy) |
Cereals |
| |
2000/01
|
2001/02
|
2000/01
|
2001/02
|
2000/01 |
2001/02
|
2000/01 |
2001/02 |
% change |
| North |
312 |
396 |
152 |
170 |
43 |
53 |
507 |
619 |
22 |
| Center |
632 |
716 |
191 |
172 |
109 |
103 |
932 |
992 |
6 |
| South |
199 |
124 |
33 |
27 |
14 |
12 |
246 |
163 |
-34 |
| Mozambique |
1 143 |
1 236 |
376 |
370 |
167 |
168 |
1 685 |
1 773 |
5 |
Mozambique: Staple food supply/demand balance 2002/03 (‘000 tonnes)
| |
Maize |
Rice (Milled) |
Wheat |
Sorghum/Millet |
Total cereals |
Cassava |
| Domestic availability |
1 316 |
191 |
46 |
380 |
1 933 |
3 083 |
| Opening stocks |
80 |
82 |
46 |
10 |
218 |
158 |
| Production |
1 236 |
109 |
0 |
370 |
1 715 |
5 925 |
| Utilization |
1 436 |
453 |
306 |
380 |
2 575 |
3 083 |
| Food use |
991 |
341 |
255 |
327 |
1 914 |
4 150 |
| Other uses, losses
|
250 |
30 |
5 |
43 |
328 |
1 775 |
| Closing stocks
|
95 |
82 |
46 |
10 |
233 |
158 |
| Exports |
100 |
0 |
0 |
0 |
100 |
0 |
| Import requirement
|
120 |
262 |
260 |
0 |
642 |
0 |
| Commercial
|
70 |
262 |
260 |
|
592 |
0 |
| Food aid |
50* |
|
|
|
50 |
0 |
|


