
|
|
|
An overview of poverty and inequality in South Africa - Working Paper prepared for DFID (SA)
|
|
APPENDIX
Figure 1a: Provincial poverty rates
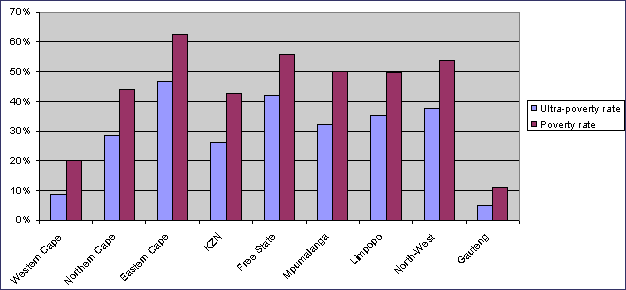
Figure 1b: Provincial poverty shares
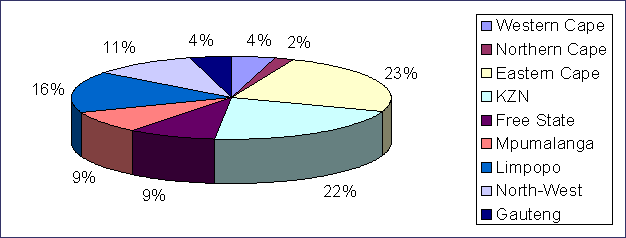
Figure 2a Poverty rates by average educational attainment of adult household members
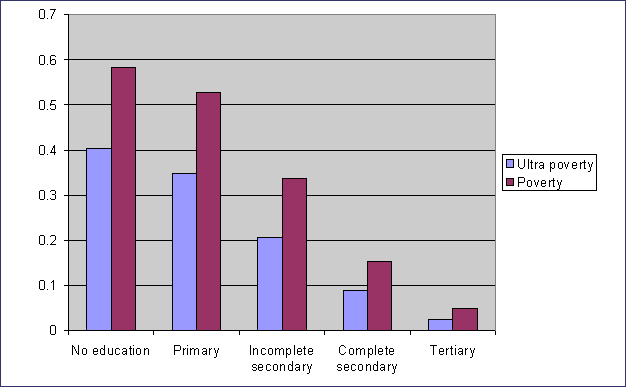
Fig 2b Poverty shares by average educational attainment of adult household members

Table 1: Infant and child mortality rates

Source: 1998 SA Demographic & Health Survey Preliminary Report, 1999.
Note: Figures in parentheses are based on 250-500 cases, while an asterisk denotes a figure based on fewer than 250 cases that has been suppressed.
Table 2: Unemployment, by race, gender and location (%)

Figure 3: Sources of income among poor and non-poor households
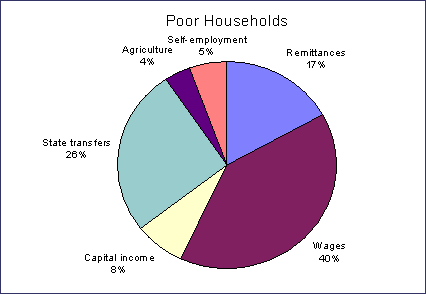
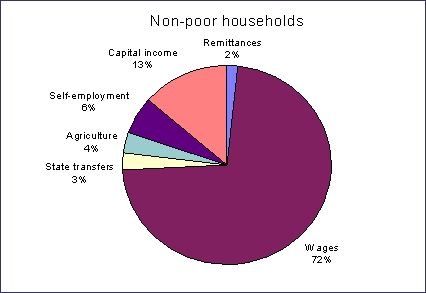
Source: own calculations on 1995 IES, Statistics South Africa.
Figure 4: Expenditure shares by decile

|
|


